


Galaxy Brain is a new blog post series covering previous talks at our annual user conference, Galaxy.
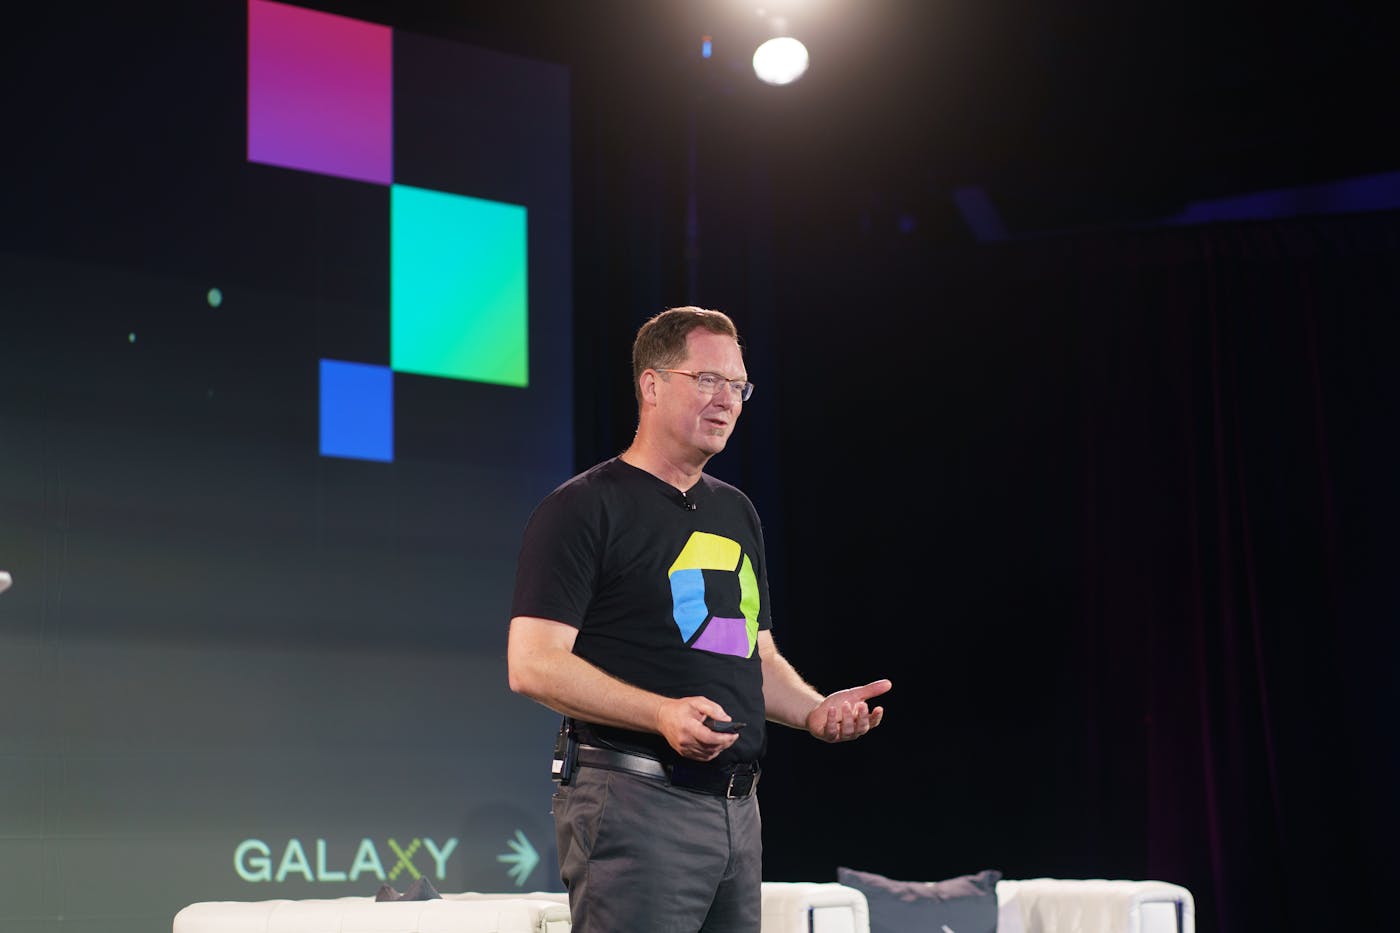
Teams are delivering software faster than ever, but speed is no substitute for quality. At this year’s Galaxy conference in Atlanta, Rob Jahn, Sr. Technical Partner Manager and DevOps Evangelist at Dynatrace, spoke about progressive delivery.
During his talk, Rob noted that industry surveys seem to indicate that teams are moving too quickly without the right processes and foundations in place, which can eventually bring down the quality of the product.
“A lot of this is hindered by the manual processes that we see people are doing,” said Rob. “Whether that's evaluating code quality, testing, approving changes, or ticketing, the processes underpinning all of these need to change as well.”
As Rob notes, the fix is not necessarily adding more tools.
"That's what people have been doing,” he said. “They have tools, they get more technology, so they add more monitoring of metrics and traces and logs, and they have more dashboards of all these things. That's really not the answer, because you can't correlate what's happening in your environment to these versions and releases. What flag has been turning on, and what does that affect? More data doesn't mean better answers.”
As it turns out, the complexity of having to bridge all this data can often lead to more time analyzing the root causes of problems and remediating things. Fortunately, as Rob is a Dynatrace expert, he was happy to walk us through some use cases to strengthen your process, which can be especially useful if you're using the Dynatrace integration for LaunchDarkly.
We strongly recommend viewing the video of the event in its entirety, so you don’t miss all the great things covered. In the meantime, here are some excerpts from what Rob's talk.
Ensuring quality throughout the lifecycle with metrics
Rob kicked things off by emphasizing the idea of using metrics provided by Dynatrace during the development lifecycle.
“If we are turning on a feature flag, for example, with the new build, we may be looking at response times, air rates, and other architectural aspects of the application,” he said.
He then demonstrated a use case where you can use Dynatrace to run what’s known as “quality gates” while moving from build to build. These gates can be used to look at security and nonfunctional requirements, among other things.
“The idea is that we want to build quality again as we're doing our thing. We need to do this in an automated way," he said. "Because if someone had to run a test, manually inspect it, or give it to a different team to manually review this, it's going to slow things down. We need this quick feedback loop. Then as we get into production, those same service levels that we're measuring as we're delivering the software can be done on the production side."
Automating release validation
Rob then explained how automatic scoring can help during the build process and provided a use case to demonstrate it.
With Dynatrace, service level indicators (SLIs) are really a metric, and a a service level objective (SLO) is how that metric is measured. To automate this, you can have metrics across response times, business transactions, or architectural aspects—like a number of database connections or security vulnerabilities—and then have a target score for them:
“Then, as I do my build, I collect my data," he said. "I can automatically evaluate my score, and then I can have another build say, ‘this introduced some additional transaction calls.’ In this case, I may say it is a failure. Then the developers come along and fix it. But, oops—they introduced a security vulnerability. Okay. Now another build comes along, and now we can fix it. This is a constant feedback loop across multiple dimensions.
"This could also be segmented by, not just the build, but also the build with this flag enabled, or the same build with a different flag enabled. You want to automatically regression test these things and have QA teams try out all these different flag combinations—because you need to do it quickly.”
Continuing on this topic, Rob highlighted how Dynatrace has an integration between its dashboarding and a declarative way to define all these definitions based on the separation of SLOs and SLIs with automatic scoring:
“We may deploy our code and set a feature as part of our deployment script," he said. "We then want to trigger an evaluation—like following some user activity—which could be either synthetic or from a real user. Or it could be like a load test from a JMeter-type product. Then we want to gather this, evaluate the score, and then decide if that build is good or bad. We're seeing many of our customers doing this and just adding in these automatic quality gate checks within their pipelines.”
One more use case with feature flags
Rob managed to squeeze in one more use case. When you can set the feature flag values in user session headers, or within the code, if there's a wrapper code at Java, and you have the parameter to the method that lets us see what version this particular user session has done, Dynatrace can pick that all up in real-time.
Because, as Robs notes, the trace is Dynatrace:
“We see the distributed trace from an end-user clicking on a browser," he said. "We can see all the browser side code, all the way to the backend calls, through all the many hops, onto your LaMDA functions, and all the way to the back end [...] a distributed trace end to end throughout the entire topology. As part of that, we can then tag essentially what that user's flag settings were. Then once we have that, now we can roll it up into different types of analysis.”
Towards the end of his talk, Rob emphasized that Dynatrace is indeed a deep observability analytics product that can be used to compare feature settings and plot out different analyses, including error rates and response times—all of which can be rolled up into dashboards, alerting rules, and a variety of other uses to strengthen both your observability and releases.
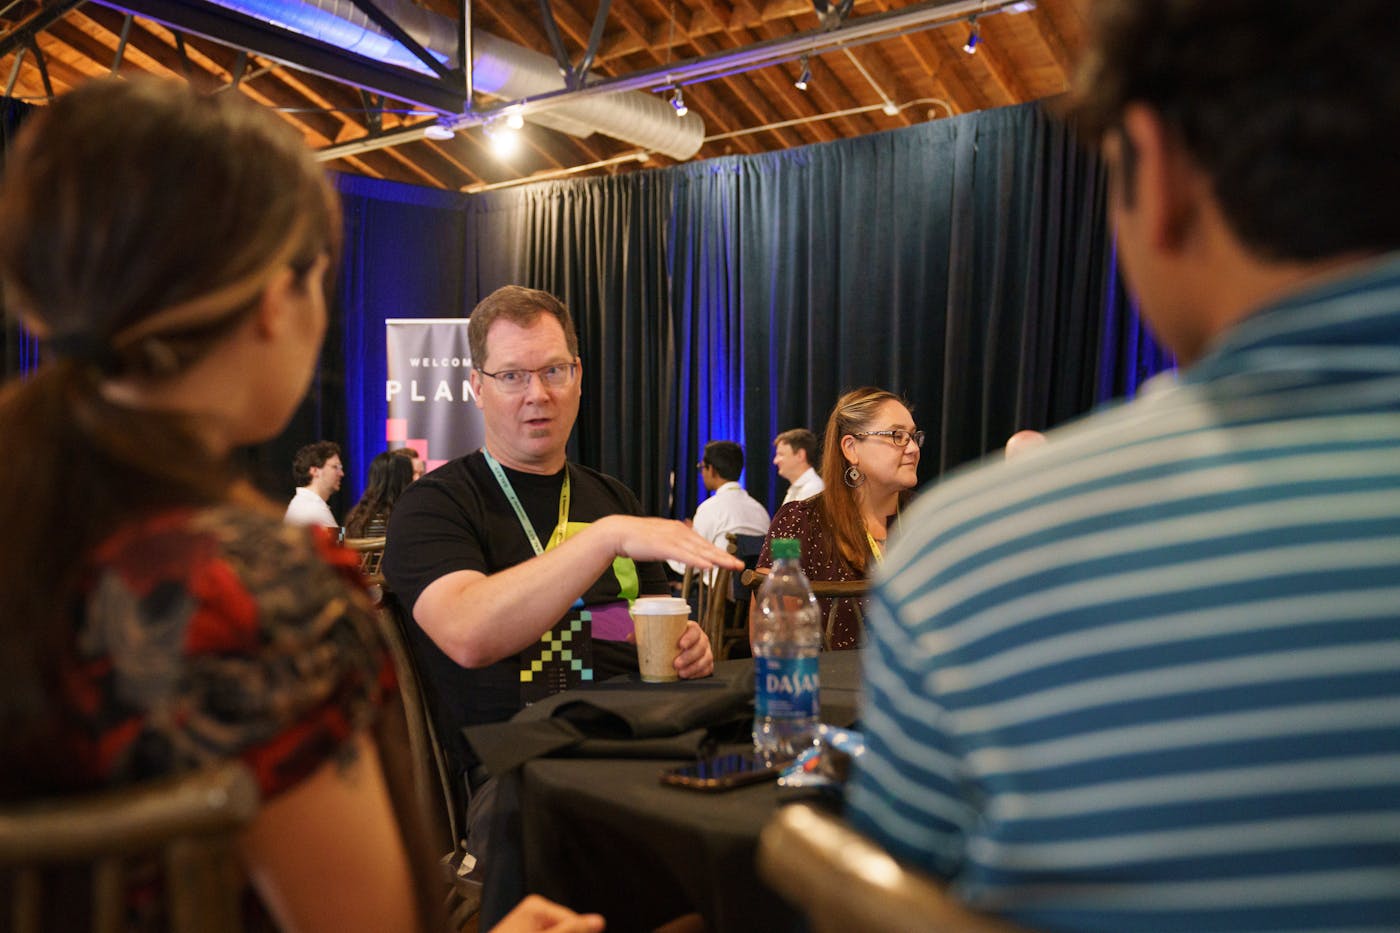
Keep in mind that Rob used plenty of visuals during his time on the Galaxy stage, so if you want to get the most out of what he had to say, including his insightful fireside chat with our own Doug Gould and audience questions, be sure to check out the full video of his closing keynote here.
Oh, and don’t forget to take a look at our docs covering Dynatrace integrations here.


